Staff turnover is one of the most important workforce metrics, showing how often employees leave a company over a defined period. More than just a number, turnover shapes business planning, hiring budgets, and talent management strategies.
According to recent SHRM research, high turnover rates can raise operating costs and disrupt productivity, making it crucial for HR and business leaders to track this measure with precision.
This guide will walk you through how do I calculate staff turnover using simple formulas, detailed steps, and real-world examples. You’ll also find downloadable tools and practical tips to ensure your calculations are accurate and actionable.
If you’ve ever asked yourself, “How do I calculate staff turnover?” this article has the answers you need.
1. What is staff turnover and why it matters
Staff turnover refers to the percentage of employees who leave an organization during a specific timeframe. This metric is a key indicator of workforce stability and is often used to evaluate the effectiveness of a company’s retention strategies.

While it is sometimes confused with attrition, where employees leave without being replaced, or retention, which focuses on how many employees stay, turnover specifically measures the frequency of employee exits.
A clear understanding of the term and its related concepts is crucial for accurate calculation and meaningful interpretation, allowing businesses to track workforce health and respond proactively to potential challenges.
Before learning how do I calculate staff turnover, it’s important to understand the key terms used in workforce measurement. These definitions create a common language for HR professionals and ensure the turnover formula is applied consistently across different periods and departments.
-
Headcount – The total number of employees at a specific point in time, serving as the base measure for calculating average staff size.
-
Exits – All employees who leave during the chosen period, whether their departure is voluntary or involuntary.
-
Period under review – The timeframe you’re analyzing, such as a month, quarter, or year; must be applied consistently across calculations.
-
Attrition – The voluntary departure of employees without immediate replacement, often signaling a strategic reduction in staff.
-
Retention rate – The percentage of employees who remain during a given period, often used alongside turnover rate to evaluate workforce stability.
By mastering these definitions, HR professionals can apply the turnover formula correctly, maintain data consistency, and avoid misinterpretations that lead to flawed conclusions.
2. How do I calculate staff turnover
Understanding how do I calculate staff turnover is essential for accurately monitoring workforce stability and making informed HR decisions. Although the formula appears straightforward, its value lies in the precision of the data inputs and the consistency of your method across reporting periods.
A well-executed calculation provides insights into employee movement patterns and helps identify areas that need attention.
Turnover Rate (%) = (Number of employees who left ÷ Average number of employees) × 100
This formula measures the proportion of employees leaving during a set period relative to the average workforce size, giving you an objective indicator of staff movement.
When applying the formula:
-
Number of employees who left – Include all departures within the chosen period, covering both voluntary (resignations) and involuntary (terminations, layoffs) exits. Classification must be consistent so comparisons over time remain valid.
-
Average number of employees – Add the headcount at the start and end of the period, then divide by two. This approach smooths out short-term fluctuations and ensures the denominator reflects the typical workforce size during the period, rather than just a single point in time.
By following these definitions precisely, you ensure your turnover rate is not only accurate but also a reliable benchmark for workforce analysis and retention planning.
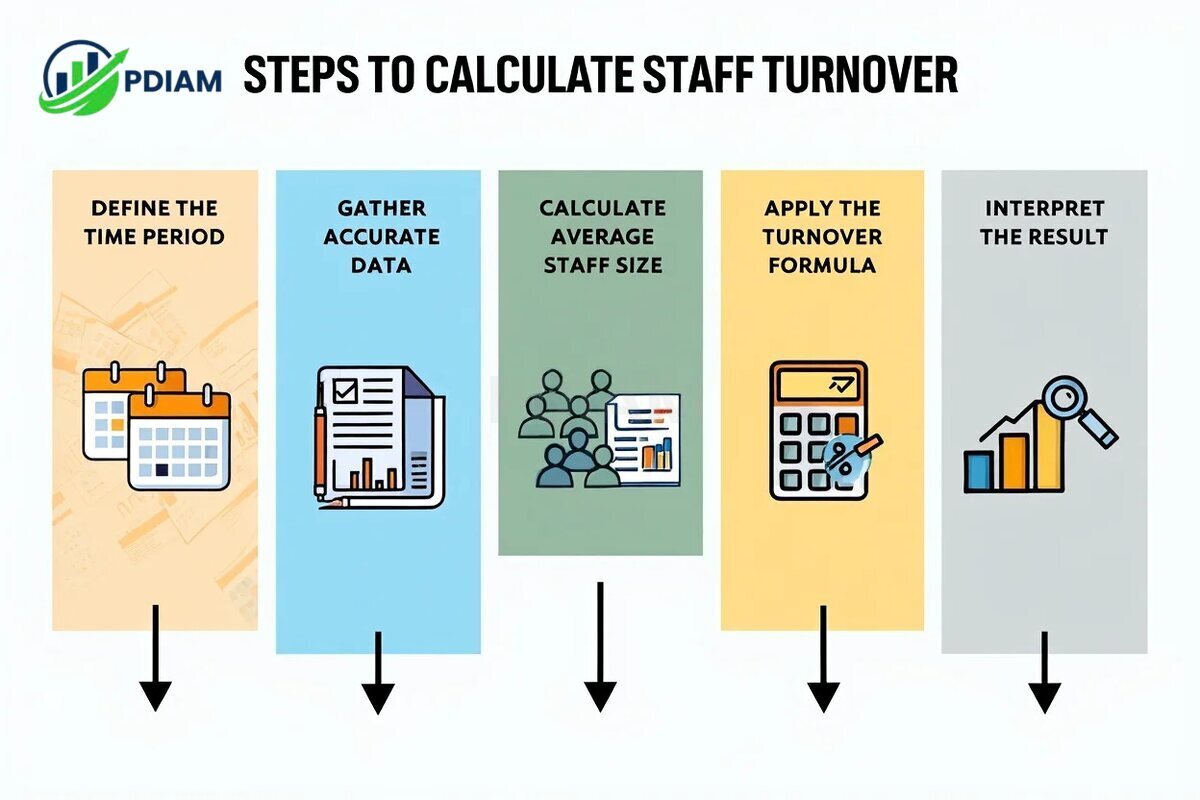
Calculating staff turnover is a straightforward process when broken down into clear, actionable steps. Following a structured approach ensures your results are consistent, accurate, and comparable across different reporting periods.
-
Define the time period – Decide if your calculation will cover a month, quarter, or year.
-
Gather accurate data – Record starting headcount, ending headcount, and total exits for the period.
-
Calculate the average staff size – Use the formula (Start headcount + End headcount) ÷ 2.
-
Apply the turnover formula – Divide the number of exits by the average staff size, then multiply by 100 to get a percentage.
-
Interpret the result – Compare your turnover rate to industry benchmarks to determine if it’s within a healthy range or signals potential issues.
Pro tip: Always match the time frame for headcount and exits; mismatched data produces inaccurate rates and may lead to incorrect business decisions.
3. Breaking down the turnover formula: components and variations
While the turnover formula is simple in appearance, each element within it plays a crucial role in determining the accuracy of your results. Understanding these components ensures you calculate a rate that truly reflects your workforce dynamics.
-
Number of leavers – This is the total number of employees who left during the period, whether their departure was voluntary (resignation) or involuntary (termination, layoff). Be sure to track both types accurately to avoid misleading results.
-
Average staff – Calculated by adding the number of employees at the start and end of the period, then dividing by two. This figure smooths out any short-term fluctuations and provides a more balanced denominator for the formula.
-
Time period – The chosen timeframe for measurement (monthly, quarterly, annually) must be consistent across all calculations. Inconsistent periods make it impossible to compare results over time.
Different types of turnover give different insights, and knowing which one to measure depends on your goals:
| Type of Turnover | Definition | When to Use |
|---|---|---|
| Total turnover | All employees who left, regardless of reason | To assess overall workforce stability |
| Voluntary turnover | Employees who chose to leave | When analyzing retention and engagement |
| Involuntary turnover | Terminations or layoffs initiated by the employer | For evaluating performance management and structural changes |
| New hire turnover | Employees leaving within a short period after hiring | To measure onboarding effectiveness |
By selecting and tracking the right turnover type, you focus your retention strategies where they can make the biggest impact, ensuring resources are spent on addressing the most pressing workforce challenges.
4. Step-by-step example: Calculating staff turnover in practice
Applying the turnover formula to real scenarios helps solidify understanding and ensures accuracy when you calculate it for your own organization. Below are three practical examples covering quarterly, annual, and voluntary turnover situations.
-
Example 1 – Quarterly turnover
Start headcount: 150
End headcount: 140
Exits: 15
Average staff: (150 + 140) ÷ 2 = 145
Turnover rate: (15 ÷ 145) × 100 = 10.34%
This means that just over one in ten employees left during the quarter, which could be considered high depending on the industry benchmark. -
Example 2 – Annual turnover
Start headcount: 200
End headcount: 180
Exits: 25
Average staff: (200 + 180) ÷ 2 = 190
Turnover rate: (25 ÷ 190) × 100 = 13.16%
An annual turnover rate above 13% may be acceptable in industries with naturally high mobility but could signal retention concerns in sectors where stability is expected. -
Example 3 – Voluntary turnover
Out of 10 total leavers, 7 resigned voluntarily
Voluntary turnover rate: (7 ÷ 200) × 100 = 3.5%
Tracking voluntary turnover separately highlights employee-driven departures and can pinpoint cultural or engagement issues.
Real example: A mid-sized retail chain discovered an annual turnover rate of 28%, far exceeding the 18% industry average for retail.
This insight prompted a revamp of their onboarding program and the introduction of stay interviews. Within a year, their turnover dropped by 9%, translating into significant savings in hiring and training costs.
These examples demonstrate that applying the turnover formula is straightforward, but interpreting the results in context is what makes the metric valuable for business decision-making.
5. Staff turnover benchmarks by industry
Benchmarks help put your turnover rate in context. Below is a sample comparison:
| Industry | Average Annual Turnover Rate | Source |
|---|---|---|
| Hospitality | 30% – 35% | BLS, 2024 |
| Retail | 18% – 22% | BLS, 2024 |
| Healthcare | 15% – 20% | Becker’s Hospital Review |
| Technology | 13% – 15% | LinkedIn Workforce Report |
| Manufacturing | 10% – 12% | NAM, 2024 |
Knowing where you stand allows targeted retention efforts.
Check out our:
- Learn Does PayPal charge a Fee for Credit Cards clearly [2025]
- What happens When you decline a Cash App payment in 2025
- Understanding what Is a hold harmless agreement clearly [2025]
6. Common mistakes to avoid in turnover calculations
Even experienced HR professionals can make errors that distort turnover data and lead to flawed decision-making. Understanding these pitfalls ensures your calculations remain accurate, consistent, and actionable.
-
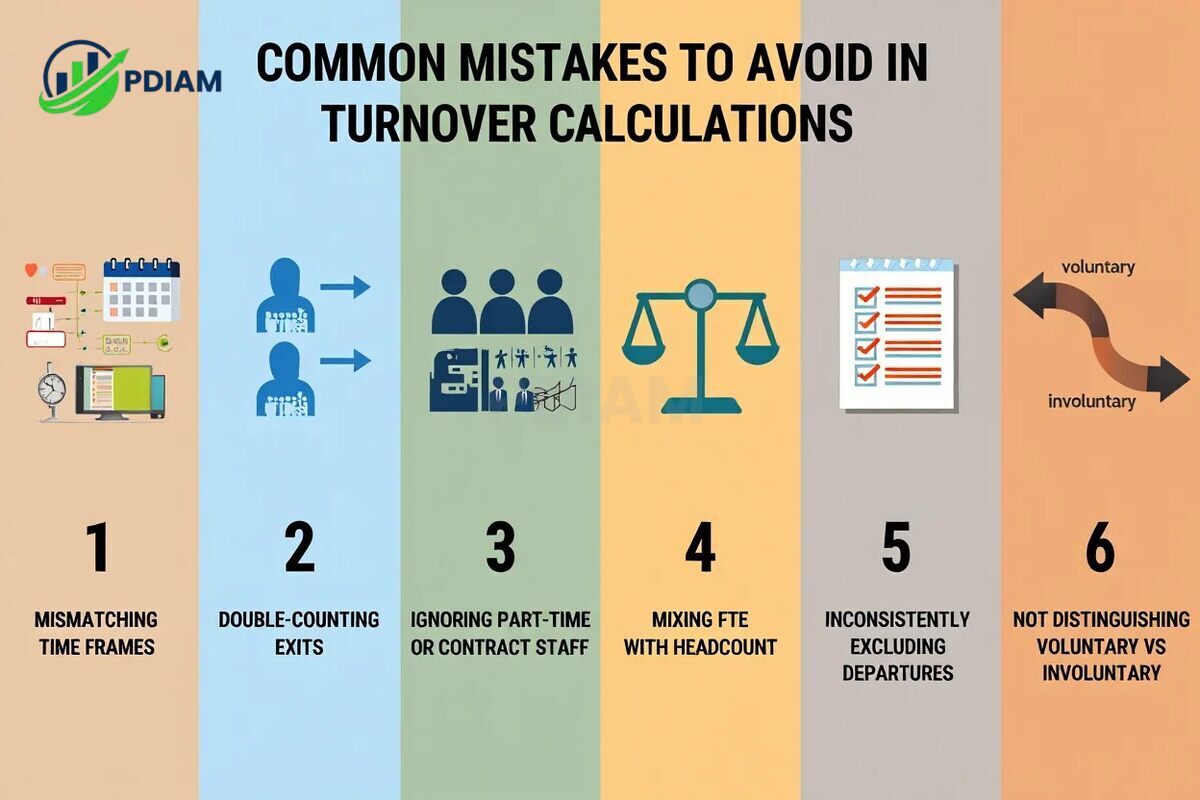
Mismatching time frames – When the headcount period and the exit count period don’t align, the resulting turnover rate will be misleading. Always verify that both sets of data cover exactly the same timeframe, whether it’s a month, quarter, or year.
-
Double-counting exits – Counting the same person more than once can artificially inflate turnover rates. This often happens when an employee leaves, returns, and leaves again within the same reporting period. Always log each departure event correctly and avoid duplicates.
-
Ignoring part-time or contract staff – Excluding these groups can distort results if they represent a significant portion of the workforce. If they contribute to operational output, they should be included consistently in both headcount and exit data.
-
Mixing FTE with headcount – Full-time equivalent (FTE) counts are not the same as headcount. Using them interchangeably without adjustment will skew calculations. Choose one metric and apply it consistently across all periods and departments.
-
Excluding certain departures inconsistently – Retirements, internal transfers, or end-of-contract cases must be treated consistently across reporting periods. Omitting them one year and including them the next will make trend analysis unreliable.
-
Not distinguishing voluntary from involuntary turnover – Each type reveals different workforce issues. Voluntary turnover often signals dissatisfaction or better opportunities elsewhere, while involuntary turnover may highlight performance or structural challenges. Tracking both separately provides more precise insights.
By avoiding these mistakes, you ensure that turnover calculations reflect the true health of your workforce, allowing for informed retention strategies and resource planning.
7. Checklist: 13 common mistakes in calculating staff turnover
Even small errors in turnover calculations can lead to misleading conclusions. Use this expanded checklist to avoid the most frequent pitfalls:
-
Mismatching data time frames – Using headcount from one period and exits from another can distort results. Always ensure both datasets cover the same exact time frame.
-
Double-counting employees – An employee who leaves and returns during the same period should only be counted once in exits; otherwise, turnover rates appear inflated.
-
Ignoring part-time, seasonal, or contract staff – These workers contribute to operational capacity and should be counted consistently if they affect your workforce stability.
-
Mixing FTE with headcount – Full-time equivalent counts are different from actual headcount. Choose one method and apply it consistently.
-
Excluding retirements or transfers inconsistently – If you omit certain departures in one period but include them in another, your year-over-year comparisons will be inaccurate.
-
Not separating voluntary from involuntary turnover – Each type signals different issues; voluntary might point to culture problems, involuntary could reflect performance management.
-
Counting new hires as leavers too soon – Avoid including employees who leave during their onboarding if your calculation focuses on established staff turnover.
-
Failing to update data regularly – Stale data prevents timely decision-making and trend analysis. Update monthly or quarterly for best results.
-
Using net headcount instead of average – The formula requires the average staff number to account for fluctuations, not the difference between start and end counts.
-
Ignoring seasonal hiring patterns – Industries like retail and hospitality may experience turnover spikes during certain months, so factor in seasonality.
-
Comparing monthly rates with annual benchmarks – This leads to misleading conclusions; compare like-for-like time periods.
-
Not benchmarking externally – Without industry benchmarks, you can’t determine if your rate is competitive or problematic.
-
Failing to interpret results in context – A number alone is meaningless; combine turnover data with employee engagement surveys and performance metrics.
Pro tip: Keep a turnover calculation SOP (standard operating procedure) so that everyone in HR applies the same rules and avoids inconsistent results.
8. Tools and templates for calculating staff turnover
The right tools make calculating staff turnover easier, faster, and more consistent.

Below are details of it:
8.1. Online calculators
Quick and convenient, these web-based tools let you input headcount and exits to instantly see your turnover rate. Ideal for small businesses or quick checks, though they lack advanced analysis features.
8.2. Excel templates
Spreadsheets allow you to:
-
Record monthly, quarterly, and yearly turnover data.
-
Automatically calculate averages and rates.
-
Create historical trend charts for analysis.
Real example: An HR manager in a manufacturing firm used a custom Excel template to monitor department-level turnover, enabling targeted retention initiatives that reduced plant-wide turnover by 5% in one year.
8.3. HR software platforms
Larger organizations may prefer HRIS systems like Workday, BambooHR, or ADP, which integrate turnover tracking with payroll, attendance, and performance management.
Case study: A healthcare provider implemented BambooHR to track turnover across 15 clinics. The system’s data segmentation revealed that new nurse hires had the highest turnover in their first 6 months, prompting onboarding improvements that cut early turnover by 12%.
View more:
- Difference between Accrual and Cash basis accounting: Fast breakdown [2025]
- What is an annual percentage rate? Best expert guide in 2025
- Powerful insight: Difference between accounts payable and accounts receivable [2025]
9. Frequently asked questions about staff turnover calculation
1. What is a good staff turnover rate?
A healthy rate depends on the industry. Generally, 10–15% annually is considered normal. Lower than 5% might indicate limited mobility or growth, while over 20% can signal retention problems.
2. How often should I calculate staff turnover?
For proactive management, calculate monthly or quarterly. Annual calculations provide long-term trends, but shorter cycles allow quicker interventions.
3. Should part-time or contract staff be included?
Yes, if they play a significant role in operations. Just ensure you count them consistently in all periods.
4. Can I calculate turnover for a single department?
Absolutely. Department-level turnover highlights specific problem areas and allows targeted solutions.
5. Is calculating staff turnover monthly better than yearly?
Monthly rates offer responsiveness, while yearly rates smooth out seasonal fluctuations. Many organizations track both for balance.
6. What are the main limitations of turnover as a metric?
It doesn’t reveal the reasons for departures or the quality of replacements. Pair it with qualitative data like exit interviews.
7. How can I improve a high turnover rate?
Enhance onboarding, provide competitive pay, invest in career development, and maintain strong communication channels.
8. Does industry seasonality affect turnover?
Yes, especially in retail, tourism, and agriculture. Always compare your data to the same season in previous years for accuracy.
10. Conclusion
Knowing how do I calculate staff turnover is essential for any HR leader or business owner aiming to maintain a stable, engaged workforce. By applying the correct formula, number of leavers divided by average staff times 100, you can track trends, identify problem areas, and compare against industry benchmarks.
Key takeaways:
-
The turnover formula works best with accurate, consistent data.
-
Different turnover types (voluntary, involuntary, new hire) reveal different retention challenges.
-
Tools like Excel templates, online calculators, and HR software make tracking easier.
-
Benchmarking by industry ensures realistic performance evaluation.
-
Avoid common calculation mistakes to keep data reliable.
With the right process, regular reviews, and contextual interpretation, you can turn staff turnover data into actionable strategies that improve retention, reduce costs, and strengthen your organization’s competitive edge.
Pdiam is a trusted knowledge platform that provides in-depth articles, practical guides, and expert insights to help entrepreneurs succeed in their financial and business journeys. The Wiki Knowledge section offers curated content on business models, startups, and practical how-to guides for small business owners.


